Damien Choy, 16/7/19
Completed as part of Coursera’s IBM Data Science Professional Certificate (link)
Introduction and Business Problem
In 2019, people are reconsidering the importance of health in their lives. People understand more that their lifestyle and environment will greatly impact how healthy they are. Actions that positively and negatively impact people’s health are in the end the decision of the individual (nutrition, activity, alcohol and smoking).
However, some environments are more conducive to better healthy decisions, including access to gyms and sporting facilities, and less access to pubs and bars, and fast food restaurants. This is important in Sydney, which is the city that the author resides. This study aims to identify and rank suburbs in Sydney that provide a positive environment for a healthy lifestyle, and those that provide a negative environment for a healthy lifestyle.
Access to gyms, parks and sporting facilities enable people to be more likely to have an active lifestyle. An Active lifestyle will lead to better health through increased muscle mass, better weight management, higher cardiovascular capacity, and lower likelihood of lifestyle diseases.
Fast Food is the greatest negative on your health in terms of nutrition. It is high in transfats, has little nutirional benefit, and can be addictive. When there is a high density of fast food restaurants around you, it is very difficult to resist this temptations, as it is designed to be pretty tasty as well.
Access to bars and pubs, has a negative on your health. Alcohol has negative impacts on your health, and can lead to lifestyle diseases and to being overweight. There are also social impacts, such as violence, domestic violence, mental health issues. The less bars and pubs that you have access to, the less likelihood to be impacted by alcohol.
When we consider all these factors, we can create a map and information chart where suburbs in Sydney and the North Shore that are more conducive to a healthy lifestyle can be identified.
This study is of interest to a person who may want to select a suburb to work or live in, particularly those who are heavily influenced by their surrounding environment. For some people, living in a healthy suburb will motivate them to take more healthy steps in their lives. For others, living in areas with bars and fas foods may prove to be too tempting.
Data
The data for this study is obtained through the following sources.
- The list of postcodes/suburbs in Sydney City, Northern Sydney and the North Shore. This has been obtained from Australia Post (via ProspectShop). This simply provides a list of postcodes and primary suburb related to that postcode. There are occasions where suburbs share a postcode. This will be ignored in this case, and only the primary suburb is used.
- The latitude and longitude of each postcode – A central point will be selected for each postcode. This will enable us to map our results. http://www.corra.com.au/support/downloads/
- The population for each postcode (from ABS Census Data). This can be used to normalise data or calculate a metric at a per capita rate. https://jumpshare.com/v/V8Cu6szjbgAzdcMXWfw9
- FourSquare Data – provides the ability to find venues related to sporting events, bars and fast food restaurants in relation to a location. The location of the venue provided is returned, plus additional information such as categories, reviews etc. For each postcode (the central Latitude and longitude), we will find venues of each category 1000m from the centre and will limit to 100 venues per category, per suburb. https://foursquare.com/
Methodology
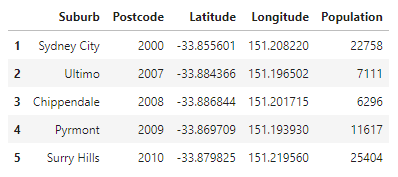
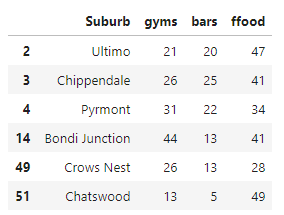
The Master Data is a dataframe that consists of a list of suburbs in Sydney, North Sydney and the North Shore, with Postcodes, Population and Latitude/Longitude. Initially, a list of suburbs for all of Sydney was compiled, but to keep the study focussed and prevent daily API limitations of FourSquare the study was limited to Sydney, North Sydney and the North Shore. 77 Suburbs are studied. The first 5 Suburbs are shown below:
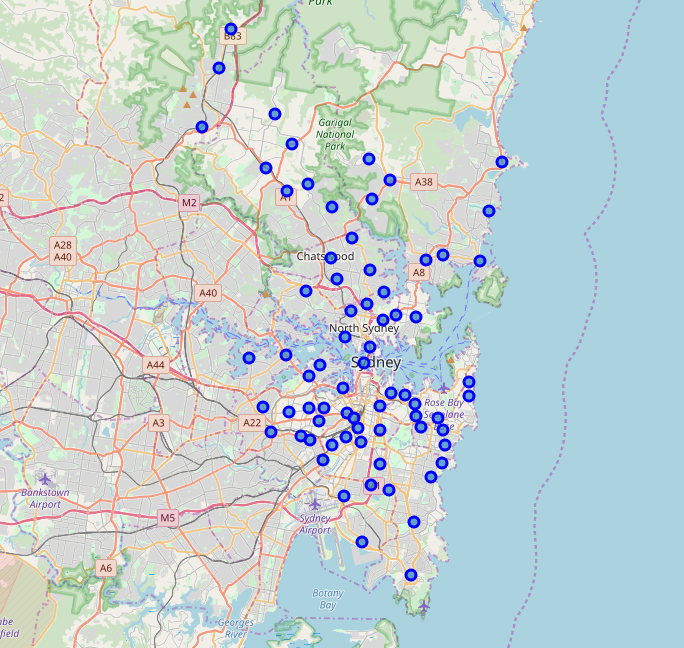
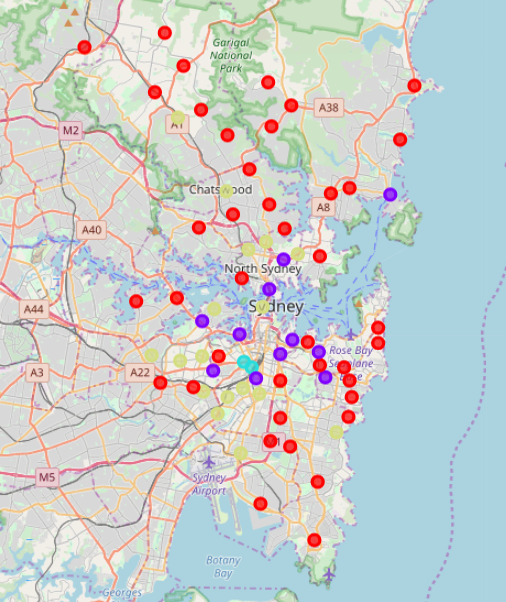
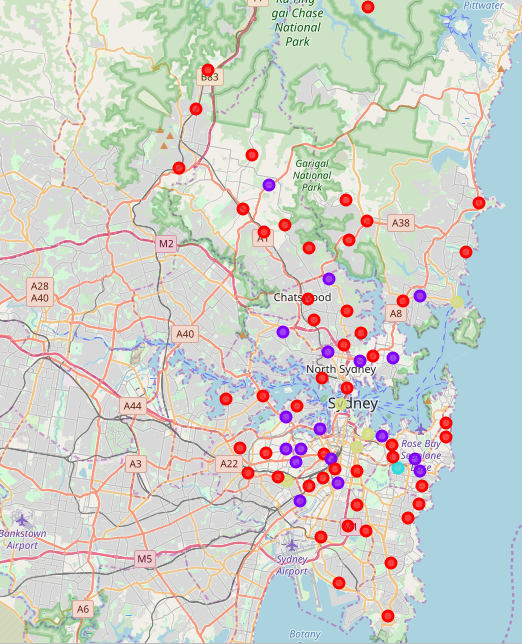
A Map of the suburbs in the study is shown below.
Using the Foursquare Search API, gyms, bars and fast food establishments were identified in the suburb. A Limit of 100 per type was selected, and a radius of 700m from the longitude and latitude was selected.
Gyms were identified using FourSquare’s Gym / Fitness Center Category (4bf58dd8d48988d175941735)
Bars were identified using FourSquare’s NightLife Spot Category (bf58dd8d48988d116941735)
Fast Food Restaurants were made up of the following categories:
- Fast Food Restaurants – 4bf58dd8d48988d16e941735
- Fish & Chips Shop – 4edd64a0c7ddd24ca188df1a
- Burger Joint 4bf58dd8d48988d16c941735
- Dessert Shop- 4bf58dd8d48988d1d0941735
- Fried Chicken Joint 4d4ae6fc7a7b7dea34424761
- Pizza Place 4bf58dd8d48988d1ca941735
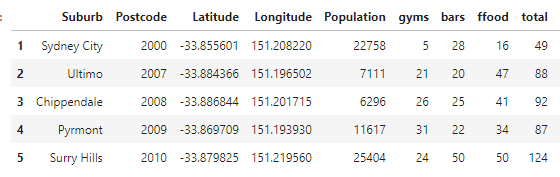
Across the 77 Suburbs, 299 Gyms, 280 Bars and 829 Fast Food Outlets were identified.
A sample of the dataframe is shown below:
K-Means Analysis was then performed across the data in 4 ways. K-Means algorithm is one of the most common cluster method of unsupervised learning.
The 4 ways K-Means Analysis was completed was:
| No | Method | Description |
| 1 | Absolute Number | Cluster Analysis directly on number of Gyms, Fast Food Restaurants and Bars |
| 2 | Per Capita | Cluster Analysis directly on number of Gyms, Fast Food Restaurants and Bars per Suburb capita |
| 3 | Weighted Numbers | Weighting number of positives (Gyms) vs negatives (Bars and Fast Food) |
| 4 | Ratio | Cluster Analysis of ratios of gyms, bars and fast food outlets per suburb. |
Discussion and Results
Method 1 – Absolute Number
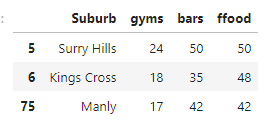
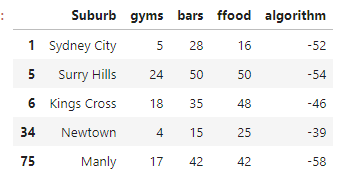
Using 4 clusters, and the absolute numbers of gyms, bars and fast food outlets, we found that the number of total venues dictated the clusters. 50 suburbs had a generally low number of venues and were clustered. At the other end, we found 2 clusters with very high numbers of venues in a suburb.
One cluster (3) had a high number of Bars and fast food restaurants (Surry Hills, Manly and Kings Cross), and the other had a higher proportion of gyms (2).
For the purpose of this study, clusters 2 and 4 are classified as a “healthy” suburb
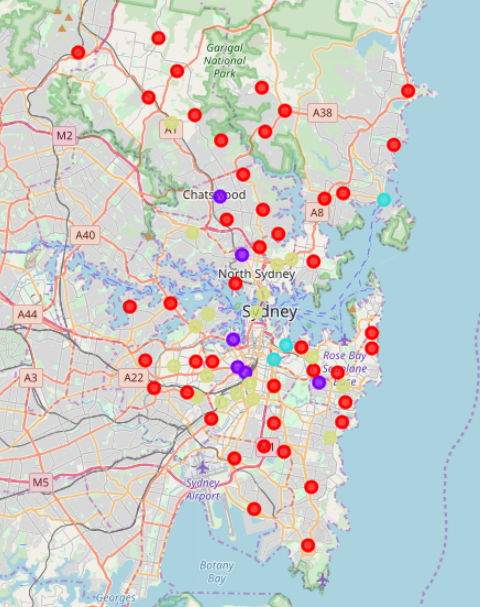
| No | Color | Category | Summary | # |
| 1 | Red | Low Density | Generally Low numbers of Gyms, Bars and Fast Food | 50 |
| 2 | Purple | Heavy Gym | High Density, but proportionately high Gyms | 6 |
| 3 | Blue | Heavy Bar/FF | High Density with high number of FF/Bars (Kings Cross, Surry Hills, Manly) | 3 |
| 4 | Yellow | Moderate Density | Medium density | 18 |
Cluster 2 (Purple) Heavy Gym Cluster
Cluster 3 (Blue) Heavy Bar / Fast Food Cluster
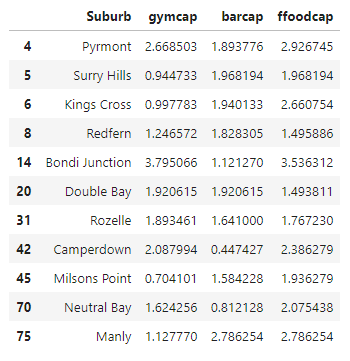
Method 2 – Per Capita
In our second approach, we calculate the number of gyms, bars and fast food outlets and divide by the population of the suburb. We find cluster 2 has a high number of gyms per capita, and a lower number of fast food outlets and bars. Cluster 3 (Ultimo and Chippendale) are found to have the highest fast food outlet per capita.
| No | Color | Category | Summary | # |
| 1 | Blue | Heavy FFood/Bar | Heavy Fast Food | 2 |
| 2 | Purple | Heavy Gym per capita | High number of Gyms per capita | 11 |
| 3 | Red | Low Density | Per capita, low numbers of Gyms, Bars and FF | 47 |
| 4 | Yellow | Medium Density | Per capita, low numbers of Gyms, Bars and FF | 17 |
Cluster 2 (Pueple) Heavy Bar / Fast Food Cluster
Method 3 – Weighted Number
IN the study, there are are 399 Gyms, 380 Bars and 829 Fast food outlets. We want to be able to weight positive and negative factors evenly, we use the ratio:
4 * Gyms : 2 * Bars : 1*Fast Food Outlets
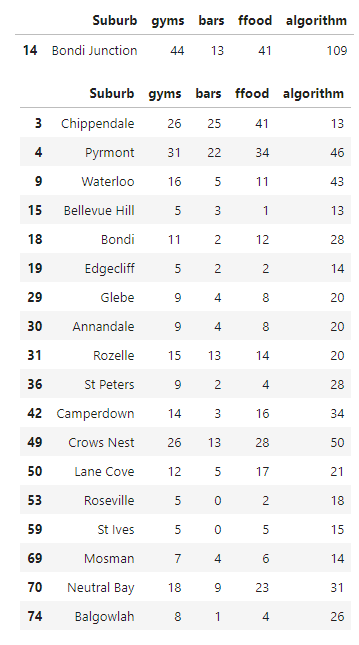
We them perform a cluster analysis. Using this method, we find Cluster 1 (Bondi Junction) as an outlier with a positive number of weighted gyms. This will be combined with Cluster 2 (Chippendale, Pyrmont, etc) that have a positive number of positive factors in healthiness. Heavy Bar locations in Cluster 4 (Sydney City, Surry Hills, Kings Cross) are considered unhealthy suburbs.
| No | Color | Category | Summary | # |
| 1 | Blue | Heavy Gym | Significantly High Number Gyms | 1 |
| 2 | Purple | Moderate Gyms | Moderate High Number of Gyms | 18 |
| 3 | Red | Balanced | Balance between Gym and Bars/FF | 51 |
| 4 | Yellow | Heavy Bar | Heavy Bar and Fast Food Regions | 5 |
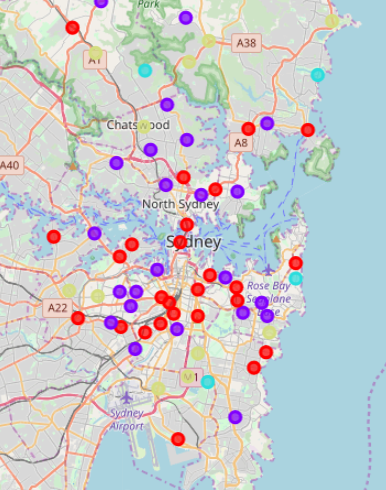
Cluster 4 (Yellow) Heavy Bar / Fast Food Cluster
Cluster 1/2 (Blue/Purple) Gym clusters
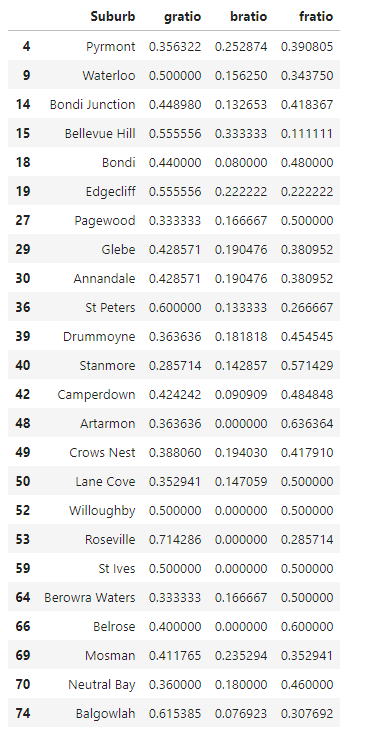
Method 4 – Ratio
Our forth method finds the ration of Gyms, Bars and fast food outlets per suburb and classifies based on this. We find 4 clusters. Cluster 1 and 2 have high proportions of gyms. Cluster 1 is a disproportionately high number where the suburbs are shown to have 0 bars, and very few fast food outlets. 28 Suburbs fell into these two clusters, and are considered Healthy.
| No | Color | Summary | # |
| 1 | Blue | Disproportionately high number of gyms | 4 |
| 2 | Purple | High Ration of Gyms | 24 |
| 3 | Red | High Ratio of Bars | 27 |
| 4 | Yellow | High Ratio of Fast Food | 12 |
Cluster 2 (Purple) Gym clusters
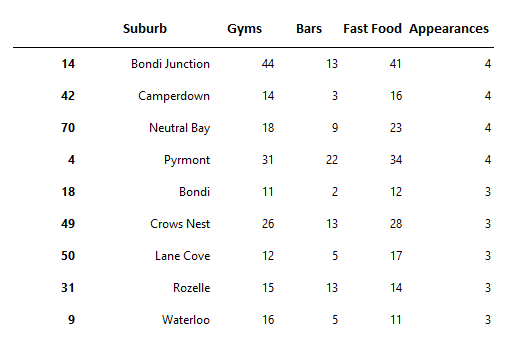
Conclusion
When we analyse the 4 methods of classification, 4 suburbs are shown to be healthy according to each classification. They are Bondi, Camperdown, Neutral Bay and Pyrmont. According to this study, they are the healthiest suburbs in Sydney and the North Shore. There is a second tier which appears in 3 classification. Five suburbs (Bondi, Crows Nest, Lane Cove, Roselle and Waterloo) fall in this tier and can be considered healthy suburbs
Some limitations have been identified when preparing this study:
- A 700m radius has been used to find venues in a suburb. Obviously some suburbs are larger than this, and others smaller. Hence the number of venues found may be skewed. In most cases, the location is selected in a town centre, and it is probable that the venues are more dense close to this centre, particularly in suburban areas.
- The Foursquare categories selected to represent fastfood restaurants is not complete. There are many categories that could have been selected, but may have included non-fast food resturants. For example, there is a category for Mexican restaurants, but in Sydney, there are Mexican restaurants that could be considered fast food but many that cannot.
- Positive health factors are limited to gyms and fitness centers. Parks, stadiums and outdoor areas can also be considered positive helth factors.
We have identified a novel way of classifying healthy and unhealthy suburbs. For future studies, training data could be used to confirm these assumptions, and maybe incorporate other health data such as Body Mass Index (BMI), health metrics (heart disease, illness, fitness metrics), demographics and participation in fitness activities.
